* All product/brand names, logos, and trademarks are property of their respective owners.
Have you ever looked at your website analytics and thought, “Okay… but what are users actually doing on my site?”
Numbers like bounce rate, session duration, and pageviews tell part of the story but not the whole picture. They don’t show you why users behave the way they do, where they hesitate, or what they’re ignoring completely.
That’s where heatmaps come in.
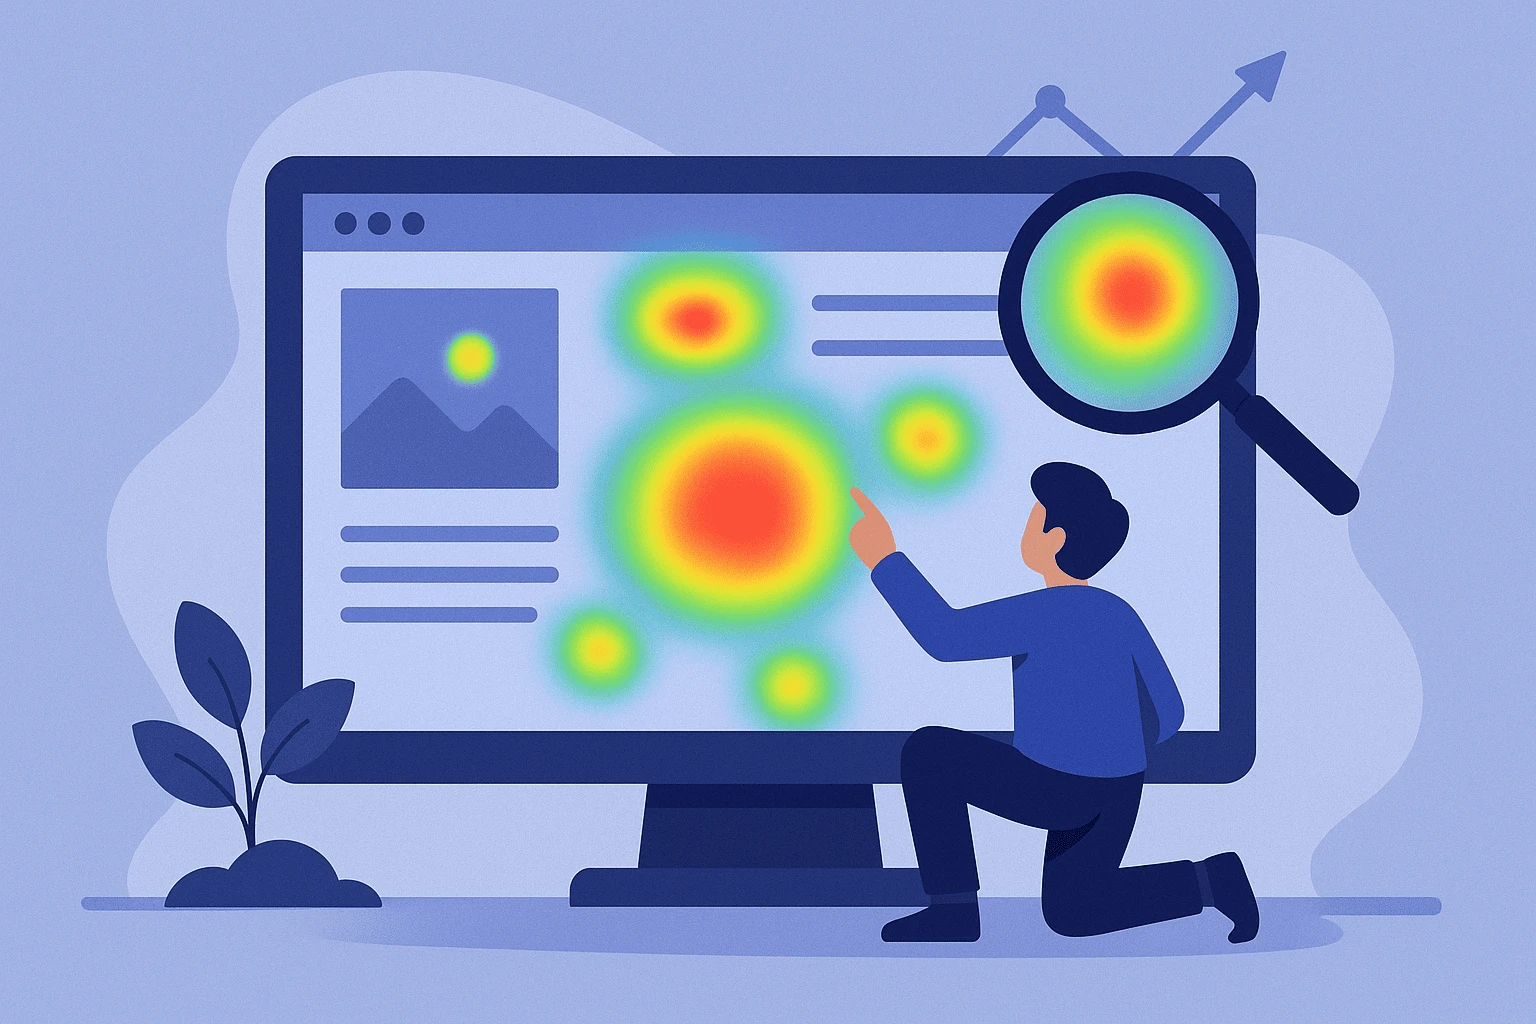
Heatmaps are a game-changer when it comes to truly understanding user behavior. They offer a visual representation of where users click, scroll, move their mouse, and spend their time. Unlike traditional analytics, heatmaps let you see the user journey, showing you patterns that numbers alone often miss.
Imagine discovering that most of your visitors never scroll past the first half of your landing page… or that they’re clicking on something that doesn’t even link anywhere. These insights are gold and they can lead to major improvements in your website's user experience (UX), engagement rates, and even conversions.
In today’s competitive digital landscape, understanding your audience’s behavior is no longer optional it’s essential. Whether you run an e-commerce site, a blog, a startup landing page, or a corporate website, heatmaps can uncover hidden opportunities for improvement.
In this blog, we’ll break down:
What heatmaps are and the different types available
How they help uncover bottlenecks in UX and conversion paths
Step-by-step strategies to implement and analyze heatmaps
The best tools to get started and advanced trends to watch in 2025
Let’s dive into the visual side of analytics and learn how to use heatmaps to not just observe but improve how your users experience your website.
Heatmaps come in different flavors, each designed to track a specific type of user interaction. Here’s a quick breakdown of the most common ones:
Click Heatmaps: These show where users are clicking the most on your webpage. Buttons, navigation menus, images any area with heavy click activity will be lit up like a hotspot. It's an easy way to see if your CTAs are working or if users are getting distracted by non-clickable elements.
Scroll Heatmaps: These track how far users scroll down a page. They're super helpful for understanding if people are seeing your content below the fold or dropping off halfway. If 70% of your visitors never make it to the bottom of a key landing page, that’s a red flag.
Mouse Movement/ Hover Heatmaps: These track where users move or hover their mouse often considered a proxy for attention. While not always 100% accurate, it gives you a rough idea of what areas people are focusing on or reading.
Attention Heatmaps (also called Eye-Tracking Simulators): These use AI to estimate where the user's attention is likely going based on design layout and content structure. Some advanced tools even use predictive modeling based on thousands of real-user interactions.
AI-Powered Heatmaps: Tools like heatmapAI or Attention Insight use artificial intelligence to predict user behavior without even needing actual traffic. They're incredibly helpful for A/B testing concepts, designing new landing pages, or speeding up UX research.
So, why go visual when you already have Google Analytics?
Because heatmaps make user behavior intuitive and easy to interpret. Here’s what they help you do:
Spot UX Friction Instantly: If users are rage-clicking or missing your CTA entirely, you’ll see it right away. This helps fix frustrating issues before they impact conversions.
Make Data-Backed Layout Changes: Move buttons, shift text, or re-prioritize content based on real behavior not guesswork.
Validate A/B Tests Visually: Pair heatmaps with your split tests to understand not just what variant wins, but why.
Understand Content Performance: Are people reading your blog posts all the way through? Are they skipping key info? Scroll heatmaps will tell you.
Optimize for Mobile & Desktop Separately: User behavior changes drastically by device. With heatmaps, you can segment data and tailor your optimizations accordingly.
Heatmaps aren’t just for web designers or UX pros marketers, product teams, and founders can all benefit. Here are some real-world use cases:
Ecommerce: Track where users abandon their cart, skip over product info, or miss a discount banner.
Landing Pages: Test CTA positions, form field friction, and whether your hero section is doing its job.
Blogs & Content Pages: See which parts of your content get the most attention optimize for readability, ad placement, or lead gen.
Customer Support Pages: Discover if users can find help articles or are bouncing before they get the answers they need.
A/B Testing and Experimentation: Use heatmaps to get qualitative insights to complement quantitative A/B test data.
If you're new to heatmaps, don't worry getting started is easier than you think. Here's a simple roadmap to help you set things up and start seeing results:
Step 1: Define Your Goal
Are you trying to increase sign-ups, improve click-through rates, reduce bounce rate, or optimize the user journey? Knowing your objective helps you choose the right type of heatmap and the right pages to track.
Step 2: Pick a Heatmap Tool
There are plenty of tools available free, paid, and even AI-powered. We'll cover these in detail in the next section.
Step 3: Install the Tracking Script
Most heatmap tools give you a code snippet to place on your site (similar to Google Analytics). It starts recording user activity right away.
Step 4: Choose Pages to Track
Focus on high-traffic or high-impact pages first like your homepage, pricing page, blog posts, or contact forms.
Step 5: Collect Data
Let the tool run for a few days (or weeks, depending on traffic) to gather enough behavior data. Make sure you look at both desktop and mobile versions.
Step 6: Analyze the Results
Look for hotspots, cold zones, rage clicks, scroll drop-offs, and other behavioral patterns. Take notes!
Step 7: Take Action
Use the insights to make changes move CTAs, adjust headlines, shorten forms, or redesign layouts based on what the heatmap tells you.
Step 8: Test, Monitor, Repeat
Heatmap insights are just the beginning. Test your changes, monitor the impact, and repeat the process regularly to keep improving UX.
Not all heatmap tools are created equal some are better for quick insights, others for deep behavioral analysis. Here’s a quick comparison of popular platforms:
| Tool | Best For | Free Plan Available | Key Features |
|---|---|---|---|
| Hotjar | All-round UX research | Yes | Click, scroll, move maps, session recordings |
| Crazy Egg | Conversion-focused insights | Yes (limited trial) | A/B testing, heatmaps, confetti clicks, snapshots |
| Microsoft Clarity | Free & detailed analytics | Yes | Heatmaps, session replays, rage click detection |
| FullStory | Product teams & SaaS applications | No | Advanced session replay, funnel analysis |
| heatmapAI | AI-powered predictions | Yes (with limitations) | Attention prediction without requiring user traffic |
| Lucky Orange | SMBs & live interaction tools | Yes (trial available) | Heatmaps, live chat, real-time analytics |
Pro tip: Start with free tools like Clarity or Hotjar if you’re just testing the waters. For deeper insights, especially on conversions, Crazy Egg and FullStory are worth considering.
Real Example 1: Ecommerce CTA Fix
An online store noticed users were rage-clicking on an image below the fold. The team added a CTA link to that image result? A 22% boost in product page visits.
Real Example 2: Blog Scroll Drop-off
A content site found that 65% of mobile users never made it past the intro. They added bold summary bullet points at the top increasing time on page by 40%.
Common Pitfalls to Avoid:
Assuming Cursor = Eye
Mouse hover doesn’t always reflect eye movement. Use scroll heatmaps and attention maps for better accuracy.
Small Sample Size
Don’t make big changes based on limited traffic. Always gather enough data before acting.
Ignoring Mobile Behavior
Mobile UX is very different always analyze both device types separately.
In 2025, heatmaps have evolved far beyond static color maps. Thanks to AI and machine learning, many tools now offer predictive analysis showing you not just what happened, but what’s likely to happen.
AI-generated Heatmaps: Platforms like heatmapAI can simulate user attention based on design patterns, even before your site gets real traffic. This is incredibly useful during early design phases or for quick A/B comparisons.
Behavioral Segmentation: Some tools cluster user behavior by visitor type e.g., returning users vs first-timers helping you spot trends in user journeys and tailor content accordingly.
Predictive User Paths: Emerging features in tools like FullStory use machine learning to suggest where users might drop off, helping you act before the friction hits.
These advanced features are a huge step forward, especially for SaaS products, ecommerce funnels, or high-traffic blogs where even small UX wins can mean big gains.
Heatmaps work best when combined with other analytics tools turning qualitative visuals into quantitative action points.
Google Analytics (or GA4): Use GA to find problem pages, then dig deeper with heatmaps to uncover why those pages struggle.
Session Replay Tools: Platforms like Hotjar and Microsoft Clarity offer both heatmaps and session recordings allowing you to follow individual users through your site.
Funnel Tracking: Pair heatmaps with funnel tools to see exactly where users drop off then use visuals to guide your fixes.
A/B Testing Platforms: Use tools like VWO or Optimizely alongside heatmaps to measure how layout changes impact behavior.
This hybrid approach lets you cover the “what, why, and how” of user behavior leading to smarter, more effective optimizations.
Not all users behave the same and heatmaps let you zoom in on specific behaviors by device, browser, location, or user type.
Mobile vs Desktop: A button that's easily clicked on desktop might be missed entirely on mobile. Segment your heatmap views to catch these differences.
New vs Returning Visitors: Returning users often behave differently they might skip to specific sections, expect faster navigation, or ignore content they’ve already seen.
Geographic or Language-Based Segments: Some heatmap tools allow you to filter by country or language, which is especially helpful for localizing user experiences (e.g., in Pakistan vs global traffic).
This level of segmentation helps ensure your website works equally well for every type of user, not just a generic average.
In the digital world, user behavior can be a mystery but heatmaps make it visual, understandable, and actionable. They take the guesswork out of UX and put real insights right at your fingertips.
By now, you’ve seen that heatmaps aren’t just colorful graphics they’re a critical tool for improving website performance, from understanding where users click, scroll, and hover, to revealing exactly where they lose interest or get frustrated. Whether you're a marketer, designer, or business owner, heatmaps can guide smarter decisions across every part of your website.
Let’s quickly recap:
Heatmaps show you what traditional analytics can’t — like user frustration, attention hotspots, and content blind spots.
They help you optimize with confidence, not assumptions from moving buttons and shortening forms to improving mobile usability.
Today’s tools are smarter than ever, with AI, predictive behavior modeling, and advanced segmentation features that take your analysis to the next level.
Pairing heatmaps with other tools like Google Analytics, session replays, and A/B testing gives you a full-circle view of user behavior.
The best part? You don’t need to be a data scientist to get started. Tools like Hotjar, Microsoft Clarity, or Crazy Egg are incredibly beginner-friendly and often free to try.
Your Next Step:
Pick one page on your website maybe your homepage or a top blog post and run a heatmap on it for a week. See what it reveals. You might be surprised at what your users are really doing.
Bonus Tip: Don’t stop at observation. Use the insights to test, tweak, and improve then track the results. Even small changes, guided by heatmap data, can lead to big improvements in user engagement and conversions.
No bio available yet.
Moving from manual work to AI-powered systems sounds exciting, but it can also feel risky without a
27 April 2026
Let’s be blunt: generic marketing is dead. In an ultra-competitive digital ecosystem wher
22 January 2026
Are your marketing efforts actually driving results — or are you just guessing? In today&rsquo
14 January 2026
Be the first to share your thoughts
No comments yet. Be the first to comment!
Share your thoughts and join the discussion below.

.webp&w=3840&q=75)
.webp&w=3840&q=75)