* All product/brand names, logos, and trademarks are property of their respective owners.
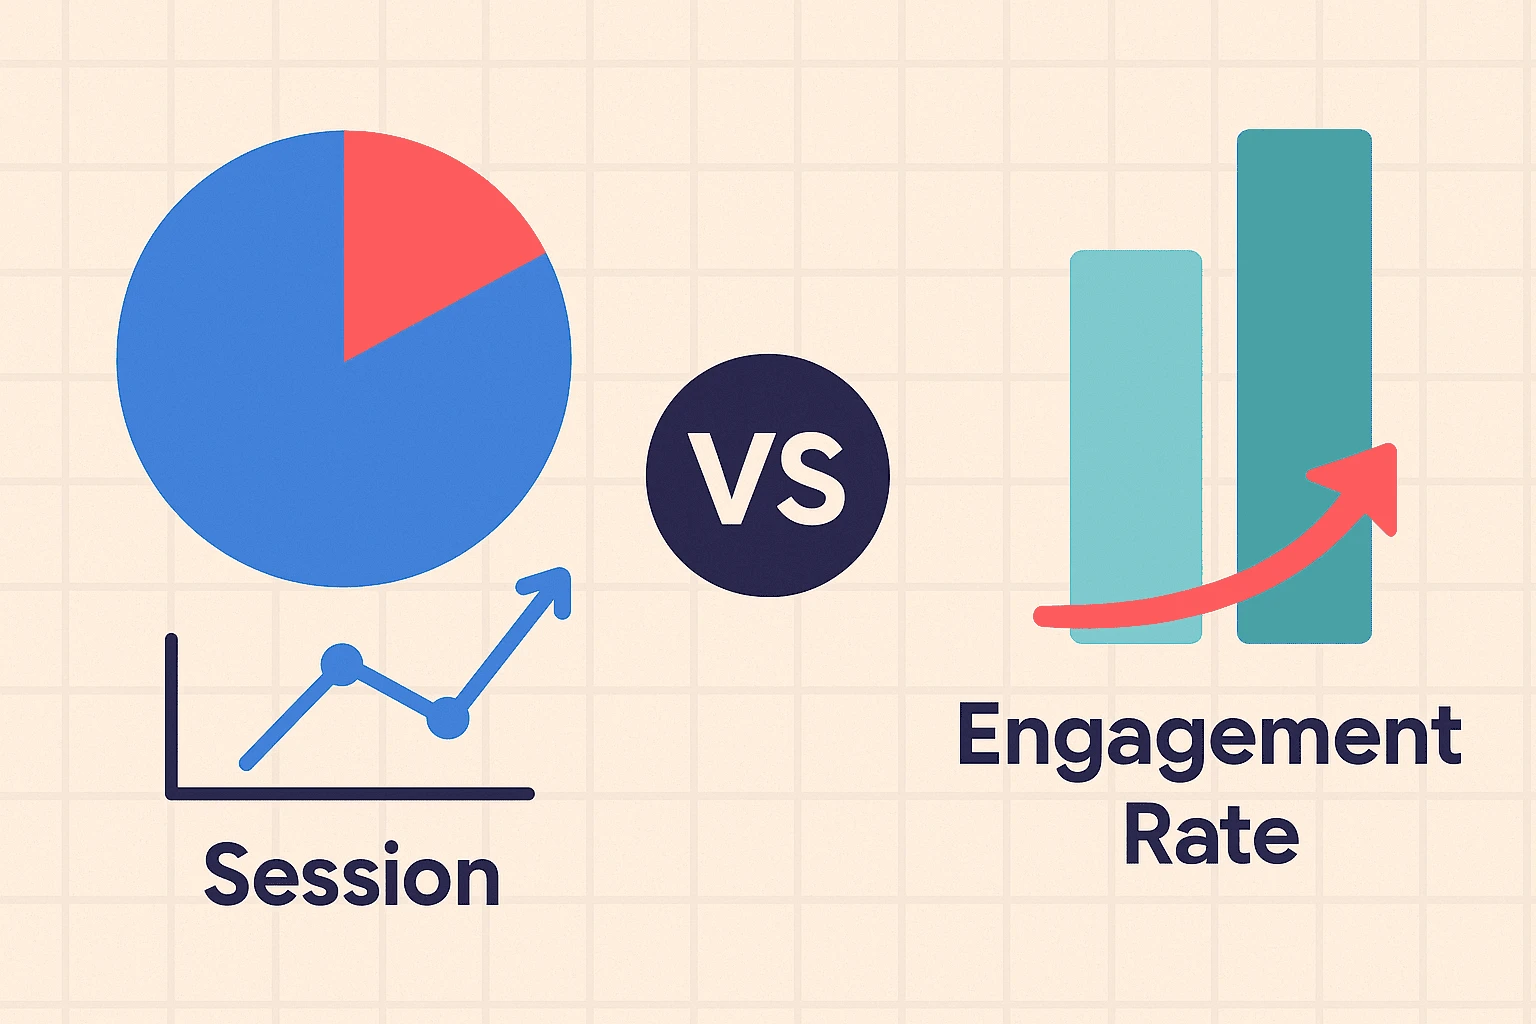
When Google announced the shift from Universal Analytics (UA) to Google Analytics 4 (GA4), many marketers and business owners felt a wave of confusion. Suddenly, familiar metrics like bounce rate and sessions looked different, and new terms like engagement rate started appearing in reports. For most people, this raised one big question: “What’s the real difference between sessions and engagement rate in GA4?”
This question isn’t just technical it’s practical. Whether you’re running a blog, an e-commerce store, or a digital marketing agency in Pakistan, knowing how to interpret GA4 data can directly impact your strategy. Misunderstanding these metrics could lead you to believe your content is failing when, in reality, it might be performing better than ever.
In Universal Analytics (UA), sessions were the backbone of reporting. Marketers would measure how many times users visited a website, how long they stayed, and whether they bounced. But GA4 changes the game. It redefines how user interactions are tracked, focusing on engagement and meaningful activity rather than just visits.
Here’s where the confusion starts: a website could have a high session count but a low engagement rate or vice versa. So which metric matters more? Should you pay attention to sessions, or is engagement rate the new king of GA4 reporting?
In this blog, we’ll break it all down in simple, everyday language. No overly technical jargon, no confusing formulas just a clear explanation of:
What sessions really mean in GA4
What engagement rate is and how it’s calculated
The key differences between the two metrics
How businesses in Pakistan (and globally) can use both together for smarter marketing decisions
By the end of this guide, you’ll not only understand the difference but also know how to use these insights to improve your digital strategy.
When most marketers hear the word “session”, they immediately think of Universal Analytics. In UA, a session simply meant a visit to your website. If a user landed on your page, clicked through a few articles, or browsed your shop all of that activity was counted as one session. After 30 minutes of inactivity, the session would end. Simple, right?
But GA4 redefines how a session works. Instead of focusing only on time, GA4 uses event-based tracking, which means every action a user takes is logged as an event. A session in GA4 is triggered by the session_start event. From that moment, GA4 begins recording all user interactions during that visit.
In Universal Analytics, sessions were tied to pageviews. But GA4 sessions are more behavior-focused. For example:
If a user visits your blog, scrolls halfway, clicks a video, and then exits GA4 counts all those actions inside one session.
If the same user returns two hours later, GA4 starts a new session, even if it’s on the same day.
This subtle difference means GA4 reports tend to show fewer sessions compared to UA, but with richer detail.
GA4 doesn’t explicitly label “session types” like UA used to (e.g., new vs returning visitors). Instead, it uses user engagement signals such as:
Session Duration – How long the user was active.
Pageviews & Events – Actions taken during the session.
Active Engagement – Whether the user interacted with the content or just left quickly.
Many marketers assume that fewer sessions in GA4 means their traffic has dropped. In reality, GA4 just tracks sessions differently. A user who interacts deeply with your site might create fewer sessions but provide more valuable engagement data.
This is why understanding sessions in GA4 is important: it shifts the focus from just “how many visits did we get?” to “what did users actually do during their visit?”
One of the most talked-about changes in GA4 is the introduction of the engagement rate metric. If you’ve used Universal Analytics before, you’re probably familiar with bounce rate the percentage of users who landed on your page and left without taking any meaningful action. Bounce rate often confused marketers, because sometimes a user could read a whole article, get exactly what they needed, and leave yet that counted as a “bounce.”
GA4 fixes this by replacing bounce rate with engagement rate a metric that focuses on positive interactions rather than exits.
According to Google, a session is considered engaged if it meets at least one of these conditions:
Lasts longer than 10 seconds
Has 2 or more pageviews or screen views
Triggers a conversion event (like signing up, purchasing, or clicking a CTA)
The engagement rate is then calculated as:
Engaged Sessions ÷ Total Sessions × 100
So if you had 1,000 sessions on your website and 650 of them met the above conditions, your engagement rate would be 65%.
Bounce rate gave a very limited picture of user behavior. A blog reader could spend 5 minutes reading a detailed article and leave and UA would still consider that a “bounce.”
GA4’s engagement rate solves this by highlighting quality visits over raw numbers. Instead of punishing single-page sessions, it rewards meaningful time spent, scrolling, clicking, or converting.
This makes engagement rate a much more reliable measure of content success.
Let’s say you’re running an e-commerce store in Karachi.
A user lands on your product page, scrolls, views product images, and adds an item to their cart that’s an engaged session.
Another user visits your homepage, doesn’t click anything, and leaves within 5 seconds that’s not engaged.
Or, if you’re a blogger in Lahore:
Someone spends 3 minutes reading your latest blog post, scrolls halfway, and then exits GA4 counts this as engaged.
These examples show why engagement rate is a better reflection of true audience interest compared to bounce rate.
At this point, you know what sessions mean in GA4 and how engagement rate works. But here’s the real challenge: how do these two metrics compare, and which one should you prioritize?
Think of it this way:
Sessions tell you how many times people visited your site.
Engagement rate tells you how valuable those visits were.
Both metrics are useful, but they serve very different purposes.
| Metric | What It Measures | Example in Action | Why It Matters |
|---|---|---|---|
| Sessions | Total visits to your site (triggered by session_start) |
1,000 people visited your blog this month | Shows reach and traffic volume |
| Engagement Rate | % of sessions with meaningful interactions (10+ sec, 2+ views, or conversion) | 650 of those 1,000 visits engaged with content | Shows content quality & audience interest |
This simple comparison highlights a key truth: sessions tell you how many came, engagement rate tells you how many cared.
If you’re focused only on traffic, sessions might look impressive. But without engagement, traffic is just a vanity number. For example, a site with 10,000 sessions and a 20% engagement rate is far less effective than one with 5,000 sessions and a 70% engagement rate.
In today’s competitive digital space, quality beats quantity. Engagement rate gives you a clearer signal of what’s actually working.
Consider a Pakistani clothing brand running Facebook ads to drive traffic to its website:
Ad Campaign A brings in 5,000 sessions but only 25% of those users engage.
Ad Campaign B brings in 3,000 sessions with a 70% engagement rate.
Campaign B drives fewer visits but delivers more meaningful interactions, such as browsing multiple products and adding items to cart. This insight helps marketers reallocate ad spend toward high-engagement campaigns, not just high-traffic ones.
So far, we’ve looked at sessions as a measure of traffic volume and engagement rate as a measure of quality. But here’s the truth: the real power of GA4 comes when you analyze both together.
Instead of treating them as competing metrics, think of them as two sides of the same coin. Sessions tell you how many doors opened, while engagement rate tells you how many people stepped inside and stayed.
If you’re running a blog or news site, high sessions mean your content is attracting readers maybe through SEO or social media. But engagement rate reveals if they actually read, scroll, and interact.
Example: A blogger in Islamabad gets 2,000 monthly sessions on a post but only a 30% engagement rate. This means readers are clicking but leaving quickly, signaling the content may not meet their expectations.
Action Tip: Improve readability with shorter paragraphs, visuals, and CTAs to boost engagement.
For online stores, combining these metrics helps you see the full customer journey:
A Lahore-based e-commerce brand may notice 10,000 sessions from a TikTok ad campaign. On the surface, it looks like a success. But if engagement rate is only 20%, it shows visitors aren’t interested in the products or website experience.
Action Tip: Optimize product descriptions, improve site speed, and add localized offers (like free delivery in Karachi or Lahore) to keep users engaged.
High Sessions + High Engagement Rate → Winning content or campaign.
High Sessions + Low Engagement Rate → Traffic mismatch (wrong audience or poor content).
Low Sessions + High Engagement Rate → Great content, but needs better promotion.
Low Sessions + Low Engagement Rate → Weak content or targeting; requires rethinking strategy.
By combining sessions and engagement rate, marketers can avoid the trap of chasing “big numbers” and instead focus on metrics that actually drive growth and conversions.
The shift from UA to GA4 has left many marketers scratching their heads, especially when it comes to understanding sessions vs engagement rate. At first glance, both metrics seem similar, but as we’ve explored, they serve very different purposes.
Sessions in GA4 tell you how many times users visited your website. It’s a measure of reach and traffic volume.
Engagement rate, on the other hand, tells you how meaningful those visits were. It measures whether users spent time, viewed multiple pages, or triggered important actions like conversions.
Put simply: sessions measure quantity, engagement rate measures quality.
For digital marketers, bloggers, and businesses in Pakistan (and worldwide), the smart move is to use both metrics together. High session counts without engagement may look good on paper but won’t bring results. Meanwhile, even a smaller audience with a strong engagement rate can deliver loyal readers, repeat customers, and higher conversions.
As you explore GA4, remember that numbers are only useful if you know what story they’re telling. By combining sessions and engagement rate, you’ll gain a full picture of your audience’s behavior who’s visiting, who’s staying, and who’s taking action.
Whether you’re running an e-commerce brand in Lahore, a startup in Karachi, or a blog in Islamabad, mastering these metrics will help you make smarter, data-driven decisions.
So the next time you open GA4, don’t just ask: “How many people visited my site?”
Instead, ask: “How many people actually cared?” because that’s the true measure of success in today’s digital world.
No bio available yet.
Something big has changed in the way we use data—and most people haven’t fully caught up
20 April 2026
On one side, you have edge analytics, designed for speed and immediate decision-making. It processes
27 February 2026
Imagine knowing what your customers want before they even ask. Picture preparing for market shifts,
20 January 2026
Be the first to share your thoughts
No comments yet. Be the first to comment!
Share your thoughts and join the discussion below.


.webp&w=3840&q=75)