* All product/brand names, logos, and trademarks are property of their respective owners.
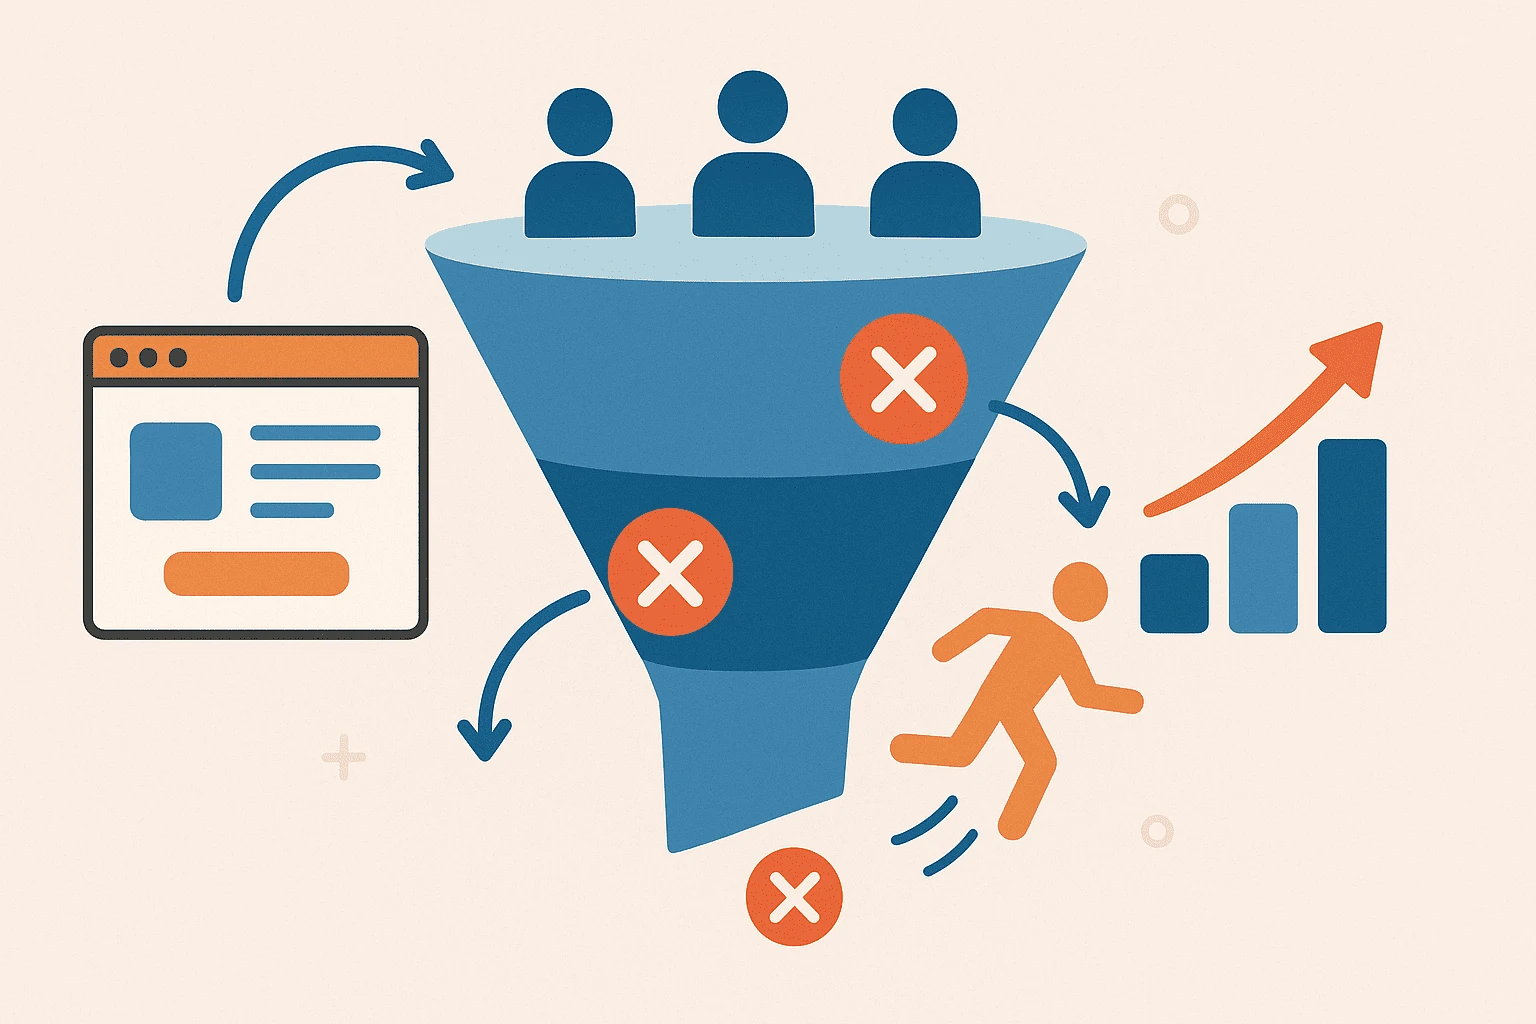
Every marketer dreads it that moment when a potential customer gets so close to converting… and then disappears. No click. No sign-up. No sale. Just silence.
These moments aren’t just frustrating they’re expensive. Whether you're running a Shopify store, a SaaS product, or a service-based business, funnel drop-offs can quietly eat away at your conversions and profits. And the worst part? Most businesses don’t even know where it’s happening, let alone why.
That’s where this blog comes in.
In today’s digital landscape, simply attracting traffic isn’t enough. You need to guide users smoothly through every step of your funnel from landing page to checkout and identify exactly where and why they drop off. The good news? With the right tools and approach, you can uncover those weak points, patch the leaks, and watch your conversions grow.
In this guide, we’ll walk you through:
How to identify exact drop-off points using tools like GA4, Hotjar, and more
Why users abandon the journey and what you can do about it
Proven ways to fix funnel leaks and keep visitors moving
Tools and templates to help streamline your optimization process
Whether you're just getting started or looking to fine-tune your conversion funnel, this guide will give you the step-by-step clarity you need in plain English, no fluff.
Let’s dig into the funnel and start fixing what’s costing you growth.
Understanding where your users leave is the first step to fixing your funnel. It’s not about guesswork it’s about data, behavior, and smart tracking. Let’s break it down into actionable steps.
Before diving into analytics, you need a clear picture of the journey you want your users to take. This means identifying the major stages of your funnel from awareness to conversion.
Start by asking:
What’s the first touchpoint? (Ad, blog post, organic search?)
What action do I want them to take next?
What’s the final goal? (Purchase, sign-up, booking?)
Use visual tools like Funnelytics or Miro to create a customer journey map. This lets you visualize every step and helps spot where potential friction may arise even before the data confirms it.
Once your journey is mapped, bring in the numbers.
Google Analytics 4 (GA4) is a powerhouse for funnel tracking. Its Funnel Exploration report allows you to set up each stage of your funnel and see exactly where users drop off. Look for sharp declines those are your red flags.
Pair GA4 with behavior tools like Hotjar, Smartlook, or FullStory. These platforms show real session replays and heatmaps so you can literally watch where users hesitate, rage-click, or leave.
You’ll often find drop-offs caused by:
Confusing layouts
Slow page loading
Form fatigue (too many fields)
Poor mobile experience
Here’s where things get granular. Look beyond drop-off counts and focus on behavioral clues:
Bounce Rate – High on a landing page? Your messaging might not match intent.
Exit Rate – If users exit on a key step (e.g., cart), something’s broken or unclear.
Time on Page – Too short = confusion or lack of interest. Too long = friction or complexity.
Also, segment your audience:
Are mobile users dropping off more?
Is one traffic source (e.g., Facebook ads) underperforming?
Are users abandoning on a specific browser or OS?
By layering quantitative (analytics) and qualitative (recordings) data, you’ll not only see where people leave but start to understand why.
Now that you know where your users are dropping off, the next step is fixing those weak spots. Funnel optimization is part science, part psychology and fully results-driven when done right.
Not all drop-offs are equally damaging. Some might look scary in numbers but have low business impact. Others, even with moderate abandonment, could be killing your conversions.
Here’s how to prioritize:
Focus on bottom-funnel drop-offs first (e.g., cart, checkout, lead form)
Identify stages with high traffic but low conversion
Use tools like GA4 or Mixpanel to assign conversion values to each step
Example:
If 40% of users drop off on the payment page, and your average sale is PKR 5,000, you could be losing thousands daily. That’s where your energy should go first.
The majority of funnel leaks boil down to poor UX. Here’s how to plug those holes:
Simplify forms – Remove unnecessary fields and use autofill options
Boost speed – A 1-second delay in load time can reduce conversions by 7%
Make CTAs clear and action-driven – “Get Started” > “Submit”
Improve mobile experience – Pakistan’s mobile users now make up over 65% of total web traffic
Also, test for accessibility:
Is your text legible?
Are buttons large enough to tap?
Are error messages helpful or frustrating?
Every micro-friction moment adds up fix those, and you reduce abandonment instantly.
Once improvements are in place, don’t stop test everything.
A/B testing tools like Google Optimize, VWO, or Optimizely allow you to test:
Button colors, copy, and placement
Page layouts and image positioning
Navigation flows and trust signals (badges, reviews, guarantees)
Pro Tip: Always run one test at a time to isolate results. Set clear goals (e.g., increase form completion by 10%) and use statistical significance to validate wins.
Over time, you’ll build a funnel that isn’t just functional but frictionless.
Once you've identified the drop-off points and know how to fix them, the right tools can save you time, improve accuracy, and help scale your improvements. Let’s explore the best platforms and resources for each stage of funnel optimization.
To truly understand your funnel performance, you need tools that show both the what and the why behind user behavior.
Here are the top analytics tools and what they offer:
| Tool | Key Features | Best For |
|---|---|---|
| GA4 | Funnel Exploration, segmenting, user flow | Tracking drop-offs, segmentation |
| Mixpanel | Event-based analytics, cohort tracking | SaaS & app funnel tracking |
| Heap | Auto-captures interactions | Fast setup, product analytics |
| Matomo | Privacy-focused analytics | Self-hosted funnel analysis |
These tools help you visualize which steps lose the most users and which actions lead to conversions.
Understanding user behavior visually is just as important as tracking numbers. Here are tools that let you see what users actually do:
Hotjar – Heatmaps, session recordings, on-site polls
Smartlook – Advanced filtering for session replays
FullStory – Behavior-based funnels and frustration detection
Crazy Egg – Click tracking, scroll maps, and A/B testing
These platforms let you observe user friction points, rage clicks, and navigation hesitations helping you make UX-driven improvements.
To make your optimization process repeatable and scalable, use plug-and-play resources:
Templates:
Funnel Audit Checklist (Downloadable PDF)
GA4 Funnel Setup Template
A/B Test Plan Sheet (Google Sheets)
Courses & Resources:
Google’s Skillshop – GA4 training (Free)
ConversionXL (CXL) – CRO and funnel courses
Appcues Blog – Great for product-led growth and onboarding funnels
Local training – Look for digital marketing bootcamps or analytics workshops in Pakistan (e.g., DigiSkills.pk, Enablers, or Coursera PK)
These assets can help your team get aligned, speed up implementation, and build a data-informed testing culture.
Funnel drop-offs are silent killers. They chip away at your conversions, revenue, and customer trust often without making a sound. But now you know better.
You’ve learned how to:
Map out your customer journey clearly
Use tools like GA4, Hotjar, and Smartlook to spot where users are leaving
Diagnose why those drop-offs happen from poor UX to long forms or slow load times
Apply practical fixes that actually move the needle
Leverage powerful tools and templates to streamline your funnel audits
But knowing isn’t enough. Real impact comes from action. The brands that grow faster are the ones that treat conversion funnel optimization as an ongoing strategy not a one-time fix.
So here’s your next step:
Run a quick audit on your current funnel today.
Start with your highest-traffic landing page. Open up GA4. Set up a simple funnel. And ask: Where are people dropping off? Why? What can I change this week?
The smallest improvements can lead to the biggest growth. Let’s plug those leaks and make every visit count.
No bio available yet.
Moving from manual work to AI-powered systems sounds exciting, but it can also feel risky without a
27 April 2026
Let’s be blunt: generic marketing is dead. In an ultra-competitive digital ecosystem wher
22 January 2026
Are your marketing efforts actually driving results — or are you just guessing? In today&rsquo
14 January 2026
Be the first to share your thoughts
No comments yet. Be the first to comment!
Share your thoughts and join the discussion below.

.webp&w=3840&q=75)
.webp&w=3840&q=75)